nltk を用いたバイグラムの処理
頻度分布やバイグラムの練習
下記のページから「2009年1月20日,オバマ氏の大統領就任演説」のテキストを取得し,ファイル obama_inaugural_transcript.txt として保存する。
http://gaikoku.info/english/column/obama_inaugural_transcript.htm
>>> import nltk
>>> f = open('obama_inaugural_transcript.txt')
>>> raw = f.read()
>>> tokens = nltk.word_tokenize(raw)   #テキストをトークンに分割

>>> raw    #元のテキスト
'I stand here today humbled by the task before us, grateful for the trust you've bestowed, mindful of the sacrifices borne by our ancestors.\n\n I thank President Bush for his service to our nation ............................

>>> tokens   #トークンへの分割後
['I','stand','here','today','humbled','by','the','task','before','us',',','grateful','for','the','trust','you',"'ve",'bestowed',',','mindful','of','the','sacrifices','borne','by','our','ancestors','.','I','thank','President','Bush','for','his','service','to','our','nation',
............................

>>> len(tokens)    #単語数(ただし,大文字・小文字を区別している)
2648
>>> len(set(tokens))   #異なり語数(ただし,大文字・小文字を区別している)
974
全ての単語を小文字化した上で,異なり語数を調べる。
>>> tokens_l = [w.lower() for w in tokens]
>>> len(set(tokens_l))
938

#単語の出現頻度分布(Frequency Distribution)
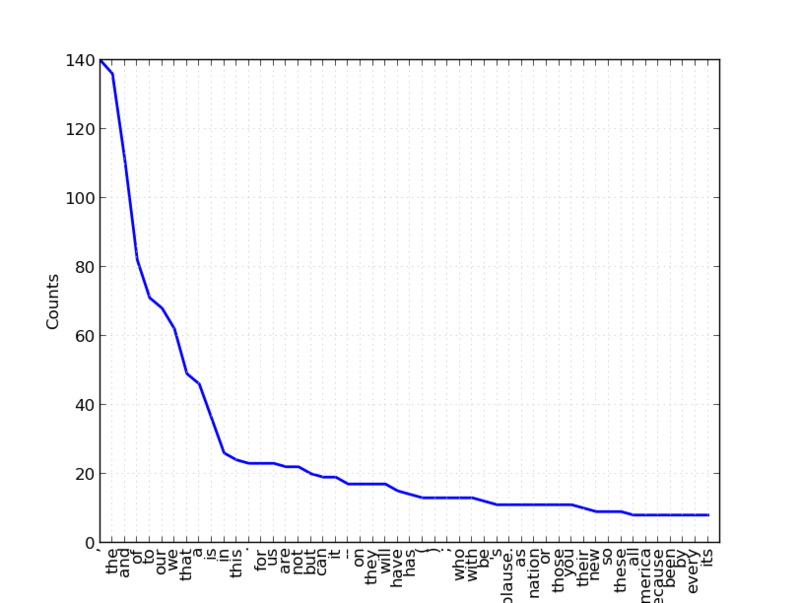
>>> fd = nltk.FreqDist(tokens_l)

#頻度分布のプロット(上位50件)
>>> fd.plot(50)

次にバイグラムを取得してみる。
#バイグラムを作る。
>>> bigrams = nltk.bigrams(tokens_l)

#バイグラムの頻度分布を得る。
>>> fd = nltk.FreqDist(bigrams)

#頻度付きで共起の結果を得る。(上位10個)
>>> fd.items()[:10]
[(('of','our'),18),((',','and'),16),((',','but'),13),((',','we'),13),((',','the'),12),(('(','applause.'),11),(('applause.',')'),11),(('we','will'),10),(('on','the'),9),(('to','the'),9)]
条件付き頻度分布(ConditionalFrequencyDistribution)を用いてbigramを扱う
参考にしたのは「入門自然言語処理」の2.2節である。
条件付き頻度分布を得る。ここでは (of, *) という形式に注目した。
>>> cfd = nltk.ConditionalFreqDist(bigrams)

#バイグラム(of,*)において*に該当する単語を頻度順で出力する。
>>> list(cfd['of'])
['our','the','a','crisis','every','peace','this','us','america','america.','americans','an','birth','charity','christians','citizenship.','civil','confidence','control.','day','dissent','each','freedom','generations.','greed','happiness.','history','humility','law','life','man','months','patriots','peace.','poor','progress','prosperity','protecting','purpose','remaking','responsibility','riches','scripture','service','short-cuts','some','standing','things','those','time.','tribe','violence','who','winter','workers']

#上記の結果を頻度付きで出力
>>> cfd['of'].items()
[('our',18),('the',4),('a',3),('crisis',2),('every',2),('peace',2),('this',2),('us',2),('america',1),('america.',1),('americans',1),('an',1),('birth',1),('charity',1),('christians',1),('citizenship.',1),('civil',1),('confidence',1),('control.',1),('day',1),('dissent',1),('each',1),('freedom',1),('generations.',1),('greed',1),('happiness.',1),('history',1),('humility',1),('law',1),('life',1),('man',1),('months',1),('patriots',1),('peace.',1),('poor',1),('progress',1),('prosperity',1),('protecting',1),('purpose',1),('remaking',1),('responsibility',1),('riches',1),('scripture',1),('service',1),('short-cuts',1),('some',1),('standing',1),('things',1),('those',1),('time.',1),('tribe',1),('violence',1),('who',1),('winter',1),('workers',1)]
データが多すぎるため,(of,*) のみを扱うよう,新たなリストを作る。
>>> for w in bigrams:
    if w[0] == 'of':
        bigrams_of.append(w)
>>> print bigrams_of
[('of','the'),('of','prosperity'),('of','peace.'),('of','the'),('of','those'),('of','our'),('of','americans'),('of','crisis'),
................]

>>> cfd = nltk.ConditionalFreqDist(bigrams_of)

>>> list(cfd['of'])
['our','the','a','crisis','every','peace','this','us','america','america.','americans','an','birth','charity','christians','citizenship.','civil','confidence','control.','day','dissent','each','freedom','generations.','greed','happiness.','history','humility','law','life','man','months','patriots','peace.','poor','progress','prosperity','protecting','purpose','remaking','responsibility','riches','scripture','service','short-cuts','some','standing','things','those','time.','tribe','violence','who','winter','workers']
・・・と,こんな面倒なことをしなくてもplotの引数conditionsを指定すれば良かった。
plot() の説明は http://nltk.googlecode.com/svn/trunk/doc/api/nltk.probability.ConditionalFreqDist-class.html#plot を参照。
>>> cfd = nltk.ConditionalFreqDist(bigrams)
>>> cfd.plot(conditions=['of'])
(of, *) のプロットは省略。
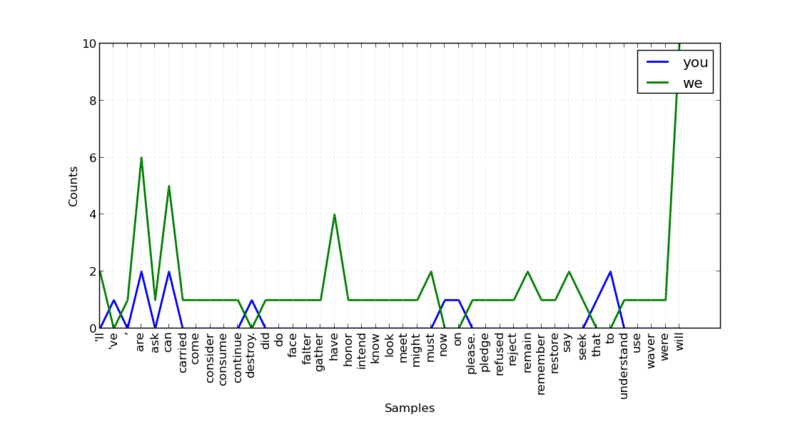
2つの単語に関するバイグラム(you,*),(we,*)をプロットする場合,次のように引数 conditions に複数の単語を与える。
>>> cfd.plot(conditions=['you','we'])

演説の特性だろうか,"you ..." という呼びかけよりも "we" を用い,かつ "we will ..." と未来志向の言葉遣いをしており,その出現頻度は 10 である。
>>> cfd['we'].items()
[('will',10),('are',6),('can',5),('have',4),("'ll",2),('must',2),('remain',2),('say',2),(',',1),('ask',1),('carried',1),('come',1),('consider',1),('consume',1),('continue',1),('did',1),('do',1),('face',1),('falter',1),('gather',1),('honor',1),('intend',1),('know',1),('look',1),('meet',1),('might',1),('please.',1),('pledge',1),('refused',1),('reject',1),('remember',1),('restore',1),('seek',1),('understand',1),('use',1),('waver',1),('were',1)]
scipy.stat.gaussian_kde()による確率密度推定
scipy.stats のインポート:
>>> from scipy import stats
Gaussian kernel density estimation のためのクラスの定義:
>>> class GaussianKernelDensityEstimation(object):
    """docstring for GaussianKernelDensityEstimation"""
    def __init__(self):
        self.gkde = None

    def fit(self, X):
        """docstring for fit"""
        self.gkde = stats.gaussian_kde(X.T)
        return self

    def predict(self, X):
        return self.gkde.evaluate(X.T)
2次元空間上に乱数を生成:
>>> X = np.random.randn(400,2)    # 標準正規分布 N(0,1) に従う乱数を400個 & 2次元
>>> print X   # サイズ 400 x 2
[[ -2.58007839e-01   5.48065715e-01]
 [  1.38392260e+00   8.88118290e-01]
 [ -5.54353637e-01  -4.50188476e-01]
 [  1.50815543e+00  -8.12178615e-02]
 [  6.12684130e-02  -8.58764228e-01]
............................
............................
 [ -6.05231082e-01   6.09153545e-01]
 [  8.76175253e-02   1.27423251e+00]
 [ -2.50029715e+00   4.42584247e-01]
 [  7.49176170e-02   1.46820415e+00]]
確率密度の値を得たい点の集合を作る:
>>> xmin, ymin = X.min(axis=0)
>>> xmax, ymax = X.max(axis=0)
>>> xx = np.linspace(xmin - 0.5, xmax + 0.5, 32)
>>> yy = np.linspace(ymin - 0.5, ymax + 0.5, 32)
>>> xg, yg = np.meshgrid(xx, yy)
>>> grid_coords = np.c_[xg.ravel(), yg.ravel()]
>>> print grid_coords
[[-4.00812329 -2.66008256]
 [-3.95031732 -2.66008256]
 [-3.89251135 -2.66008256]
 ...,
 [ 3.21762312  3.69041801]
 [ 3.27542909  3.69041801]
 [ 3.33323506  3.69041801]]
確率密度関数の推定:
>> kde = GaussianKernelDensityEstimation()   # gaussian kde のオブジェクトを作って
>>> kde.fit(X)    # ここで確率密度を推定している。
<__main__.GaussianKernelDensityEstimation object at 0xa16042c>
grid_coords に含まれる個々の点における確率密度を求める:
>>> zz = kde.predict(grid_coords)

>>> len(grid_coords)   # 2次元空間上の点が 1024
1024
>>> len(zz)  #当然,それに対応する確率密度の個数も 1024
1024
>>>
>>> for i in range(len(grid_coords)):
    print "%f,%f,%f" %(grid_coords[i][0], grid_coords[i][1], zz[i])


-4.008123,-2.660083,0.000002
-3.771305,-2.660083,0.000004
-3.534487,-2.660083,0.000006
....................
....................
2.859599,3.690418,0.000000
3.096417,3.690418,0.000000
3.333235,3.690418,0.000000
>>>
上記の結果を3列目(=確率密度)でソートした結果:
0.254601,-0.201824,0.149000
0.254601,0.003031,0.146694
0.017783,-0.201824,0.146501
0.017783,0.003031,0.144133
....................
....................
-3.060851,3.280708,0.000000
-3.060851,3.075853,0.000000
-2.824033,3.690418,0.000000
原点周辺での確率密度が大きくなっているようだ。
原点における確率密度を求めると
>>> Y = np.array([[0.0,0.0]])
>>> Y
array([[ 0.,  0.]])
>>> kde.predict(Y)
array([ 0.14375202])
サンプル数(= X のサイズ)が少ないため,原点に近いからといって最大となっていない。
ちょっと悔しいから,
50,000個のサンプルを与えて原点およびその周辺の点における確率密度を求めた。
原点から遠ざかるほど確率密度が小さくなり,原点から等距離にある4つの点での密度がほぼ等しく収束していることが分かる。
>>> X = np.random.randn(50000,2)
>>> kde = GaussianKernelDensityEstimation()
>>> kde.fit(X)
<__main__.GaussianKernelDensityEstimation object at 0xa16b22c>
>>> Y = np.array([[0.0,0.0]])
>>> kde.predict(Y)
array([ 0.14903213])
>>> Y = np.array([[1,0], [-1,0], [0,1], [0,-1]])
>>> kde.predict(Y)
array([ 0.09236879,  0.09647149,  0.09689293,  0.09497972])
>>> Y = np.array([[2,0], [-2,0], [0,2], [0,-2]])
>>> kde.predict(Y)
array([ 0.0223722 ,  0.02150799,  0.0207469 ,  0.02212046])
networkx の有向グラフ
networkx を用いて有向グラフを描いてみたら destination 側は矢印にならないのね。
少し見辛いが,これはこれとして諦めるしかない感じ。
import matplotlib.pyplot as plt
import networkx as nx
g = nx.DiGraph()
g.add_edge('a', 'b')  # a->b
g.add_edge('a', 'c')  # a->c
g.add_edge('a', 'd')  # a->d
g.add_edge('b', 'd')  # b->d
nx.draw(g)
plt.show()
pandas で scatter matrix
pandas (Python Data Analysis Library)
http://pandas.pydata.org/
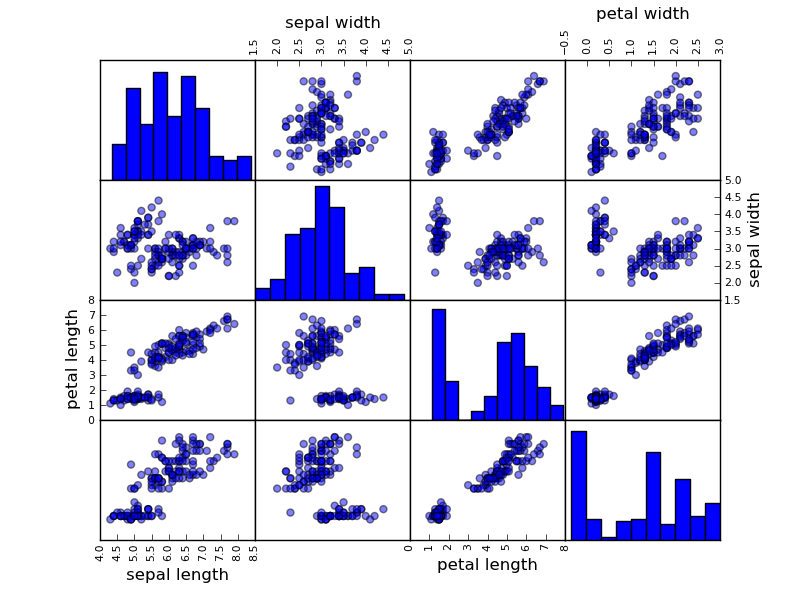
iris データを対象として scatter matrix を描画した。
>>> from pandas import *
>>> from pandas.tools.plotting import *
>>> import matplotlib.pyplot as plt
>>> data = read_csv('iris.csv')
>>> scatter_matrix(data)
array([[Axes(0.125,0.7;0.19375x0.2), Axes(0.31875,0.7;0.19375x0.2),
Axes(0.5125,0.7;0.19375x0.2), Axes(0.70625,0.7;0.19375x0.2)],
[Axes(0.125,0.5;0.19375x0.2), Axes(0.31875,0.5;0.19375x0.2),
Axes(0.5125,0.5;0.19375x0.2), Axes(0.70625,0.5;0.19375x0.2)],
[Axes(0.125,0.3;0.19375x0.2), Axes(0.31875,0.3;0.19375x0.2),
Axes(0.5125,0.3;0.19375x0.2), Axes(0.70625,0.3;0.19375x0.2)],
[Axes(0.125,0.1;0.19375x0.2), Axes(0.31875,0.1;0.19375x0.2),
Axes(0.5125,0.1;0.19375x0.2), Axes(0.70625,0.1;0.19375x0.2)]], dtype=object)
>>> plt.show()
適当にやったところ,"class" 列は文字列のためか,勝手に除いてくれた。
pandas でヒストグラム
pandas (Python Data Analysis Library)
http://pandas.pydata.org/
http://archive.ics.uci.edu/ml/datasets/Iris にて公開されている Iris データを利用する。
iris.data と iris.names を持ってきて,ヘッダ行を加工した。
$ head iris.csv
"sepal length","sepal width","petal length","petal width","class"
5.1,3.5,1.4,0.2,Iris-setosa
4.9,3.0,1.4,0.2,Iris-setosa
4.7,3.2,1.3,0.2,Iris-setosa
4.6,3.1,1.5,0.2,Iris-setosa
データ読み込みはこんな感じ:
>>> from pandas import *
>>> data = read_csv('iris.csv')
>>> data.head(10)
   sepal length  sepal width  petal length  petal width        class
0           5.1          3.5           1.4          0.2  Iris-setosa
1           4.9          3.0           1.4          0.2  Iris-setosa
2           4.7          3.2           1.3          0.2  Iris-setosa
3           4.6          3.1           1.5          0.2  Iris-setosa
4           5.0          3.6           1.4          0.2  Iris-setosa
5           5.4          3.9           1.7          0.4  Iris-setosa
6           4.6          3.4           1.4          0.3  Iris-setosa
7           5.0          3.4           1.5          0.2  Iris-setosa
8           4.4          2.9           1.4          0.2  Iris-setosa
9           4.9          3.1           1.5          0.1  Iris-setosa
ヘッダ行を分離すると共に,各行に番号を振ってくれた。
しかし,ヘッダ行が存在しない場合,どうすればよいのだろうか?
matplot.pyplot を用いてヒストグラムを描く。
>>> import matplotlib.pyplot as plt
>>> data['sepal width'].hist()
<matplotlib.axes.AxesSubplot object at 0xa0017ec>

>>> plt.show()

pandas のインストール
pandas (Python Data Analysis Library)
以下は,python 2.7 上でのテスト結果である。
準備
pandas を利用するには numpy 1.6 以上が必要となる。
自分の環境は 1.5 だったため,easy_install を用いてバージョンアップする。
$ sudo easy_install --upgrade numpy
バージョンを確認すると,以下のとおり 1.6.2 になった。
>>> import numpy
>>> numpy.version.version
'1.6.2'
pandas のインストール
以下にインストール履歴(抜粋)を示す。
ごちゃごちゃと Warning が出るが,とりあえずインストールできたっぽい。
$ sudo easy_install pandas
Searching for pandas
Reading http://pypi.python.org/simple/pandas/
Reading http://pandas.pydata.org
Reading http://pandas.sourceforge.net
Best match: pandas 0.9.0
Downloading http://pypi.python.org/packages/source/p/pandas/pandas-0.9.0.zip#md5=04b1d8e11cc0fc30ae777499d89003ec
Processing pandas-0.9.0.zip
Running pandas-0.9.0/setup.py -q bdist_egg --dist-dir /tmp/easy_install-F5ZvWK/pandas-0.9.0/egg-dist-tmp-_wXhPl
warning: no files found matching 'setupegg.py'
no previously-included directories found matching 'doc/build'
warning: no previously-included files matching '*.so' found anywhere in distribution
.............................
.............................
Installed /usr/local/lib/python2.7/dist-packages/pandas-0.9.0-py2.7-linux-i686.egg
Processing dependencies for pandas
Finished processing dependencies for pandas
$
arelle におけるコンテキスト情報内の日付処理
XBRL インスタンスのコンテキスト情報に含まれる「時点(instance)」および「期間(duration)」は,それぞれ「決算日」および「開始日と終了日」を表す。これらは arelle 内で以下の形式で表現される(以下は「前年度連結決算の時点情報」の例)。
contexts = arelle.ModelXbrl.ModelXbrl.contexts
contexts['Prior1YearConsolidatedInstant'].instantDatetime
しかし,arelle の仕様では,「決算日(instantDatetime)」と「終了日(endDatetime)」を翌日に設定することになっており,arelle により取得した日付を調整する必要がある。
プログラム例
# -*- coding:utf-8 -*-

from arelle import ModelManager
from arelle import Cntlr
import arelle
import datetime

#arelle を用いて XBRL インスタンスを読み込む
cntlr = arelle.Cntlr.Cntlr()
modelManager = arelle.ModelManager.ModelManager(cntlr)
xbrl = arelle.ModelXbrl.load(modelManager, "jpfr-asr-E05179-000-2012-03-31-01-2012-07-02.xbrl")

#コンテキスト集合の取得
contexts = xbrl.contexts

#コンテキスト中の日付処理
#
#仕様によると,endDateTime, instant の日付は翌日になる(場合もある)らしく,
#これらの日付を1日前に戻す必要がある。
#http://arelle.org/wordpress/wp-content/uploads/downloads/2011/09/ComparabilityAndDataMiningUnifiedModel-Paper.pdf
keys = contexts.keys()
for key in keys:
    print key, " : ",

    oneday = datetime.timedelta(days=1)
    context = contexts[key]
    if context.startDatetime is not None:
        print "startDatetime : ", context.startDatetime
    if context.endDatetime is not None:
        print "endDatetime : ", context.endDatetime - oneday
    if context.instantDatetime is not None:
        print "instantDatetime : ", context.instantDatetime - oneday
実行結果
CurrentYearNonConsolidatedDuration  :  startDatetime :  2011-09-01 00:00:00
endDatetime :  2012-03-31 00:00:00
Prior1YearConsolidatedInstant  :  endDatetime :  2011-08-31 00:00:00
instantDatetime :  2011-08-31 00:00:00
CurrentYearConsolidatedInstant  :  endDatetime :  2012-03-31 00:00:00
instantDatetime :  2012-03-31 00:00:00
Prior2YearConsolidatedInstant  :  endDatetime :  2010-08-31 00:00:00
instantDatetime :  2010-08-31 00:00:00
Prior2YearNonConsolidatedInstant  :  endDatetime :  2010-08-31 00:00:00
instantDatetime :  2010-08-31 00:00:00
Prior1YearNonConsolidatedInstant  :  endDatetime :  2011-08-31 00:00:00
instantDatetime :  2011-08-31 00:00:00
CurrentYearNonConsolidatedInstant  :  endDatetime :  2012-03-31 00:00:00
instantDatetime :  2012-03-31 00:00:00
Prior1YearNonConsolidatedDuration  :  startDatetime :  2010-09-01 00:00:00
endDatetime :  2011-08-31 00:00:00
DocumentInfo  :  endDatetime :  2012-07-02 00:00:00
instantDatetime :  2012-07-02 00:00:00
Prior1YearConsolidatedDuration  :  startDatetime :  2010-09-01 00:00:00
endDatetime :  2011-08-31 00:00:00
CurrentYearConsolidatedDuration  :  startDatetime :  2011-09-01 00:00:00
endDatetime :  2012-03-31 00:00:00
参考文献
instantDatetime および endDatetime の扱いは以下の文書に記述されている:
http://arelle.org/wordpress/wp-content/uploads/downloads/2011/09/ComparabilityAndDataMiningUnifiedModel-Paper.pdf